Embed Plots in a Tkinter GUI
Description:
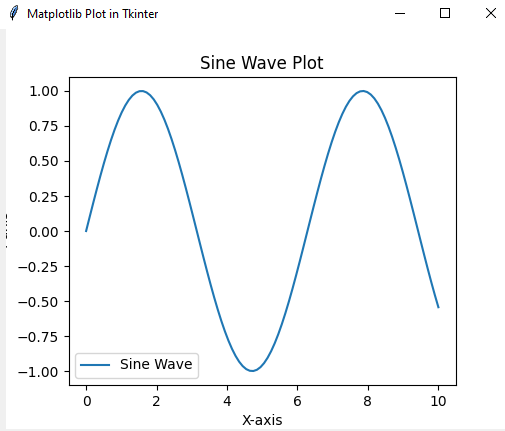
A Python program that embeds a Matplotlib plot inside a Tkinter GUI window, allowing you to interact with the plot in a graphical interface.
Code Explanation:
● Before running this code, make sure you have the necessary libraries installed using the following command:
pip install matplotlib
● import tkinter as tk: This imports the Tkinter library for creating GUI components.
● import matplotlib.pyplot as plt: This imports Matplotlib for creating the plot.
● import numpy as np: This imports NumPy to generate data for plotting (in this case, sine wave values).
● root = tk.Tk(): This initializes the Tkinter root window.
● x = np.linspace(0, 10, 100) and y = np.sin(x): These create the x-values and corresponding y-values for the sine wave.
● fig, ax = plt.subplots(figsize=(5, 4)): This creates a Matplotlib figure and axis.
● ax.plot(x, y): This plots the sine wave on the axis.
● canvas = FigureCanvasTkAgg(fig, master=root): This converts the Matplotlib figure into a Tkinter-compatible canvas.
● canvas.draw(): This draws the figure onto the canvas.
● canvas.get_tk_widget().pack(): This embeds the canvas widget in the Tkinter window.
● root.mainloop(): This starts the Tkinter event loop, keeping the window open for interaction.
Program:
import tkinter as tk
from matplotlib.backends.backend_tkagg import FigureCanvasTkAgg
import matplotlib.pyplot as plt
import numpy as np

# Create a Tkinter window
root = tk.Tk()
root.title("Matplotlib Plot in Tkinter")

# Sample data for the plot
x = np.linspace(0, 10, 100)
y = np.sin(x)

# Create a Matplotlib figure
fig, ax = plt.subplots(figsize=(5, 4))
ax.plot(x, y, label="Sine Wave")
ax.set_title("Sine Wave Plot")
ax.set_xlabel("X-axis")
ax.set_ylabel("Y-axis")
ax.legend()

# Embed the plot in the Tkinter window
canvas = FigureCanvasTkAgg(fig, master=root)
canvas.draw()
canvas.get_tk_widget().pack()

# Start the Tkinter event loop
root.mainloop()
Output: