Description:
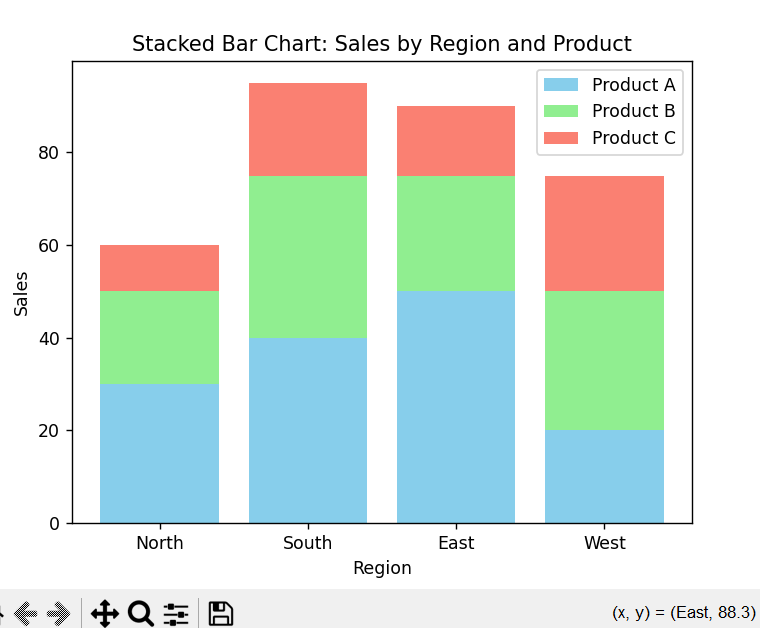
This program generates a stacked bar chart that displays the sales data of three products across different regions. The chart helps visualize how sales are distributed across the regions, with each region represented by a stacked bar containing the sales for each product.
Code Explanation:
Multiple datasets are stacked on top of each other using bar().
X-axis represents regions or categories.
Each stack represents a product's contribution in that region.
Helps visualize the total and individual contribution.
legend() differentiates each stack (product).
xlabel(), ylabel(), and title() are added for clarity.
show() displays the final stacked bar chart.
Code Explanation:
import matplotlib.pyplot as plt
# X-axis labels (regions)
regions = ['North', 'South', 'East', 'West']
# Sales data for each product
product_A = [30, 40, 50, 20]
product_B = [20, 35, 25, 30]
product_C = [10, 20, 15, 25]
# Plotting the stacked bars
plt.bar(regions, product_A, label='Product A', color='skyblue')
plt.bar(regions, product_B, bottom=product_A, label='Product B', color='lightgreen')
bottom_C = [a + b for a, b in zip(product_A, product_B)]
plt.bar(regions, product_C, bottom=bottom_C, label='Product C', color='salmon')
# Adding labels and title
plt.title('Stacked Bar Chart: Sales by Region and Product')
plt.xlabel('Region')
plt.ylabel('Sales')
plt.legend()
# Show the plot
plt.show()
Output:

Trainings :
UI UX Design Training in Indore | Python + DSA Training in Indore | DevOps Training in Indore | Data Analytics Training in Indore | Data Science Training in Indore | Full Stack Development Training in Indore | Web Development Training in Indore | Python and Django Training in Indore |Free Courses and Resource :
Verbal Aptitude | Matplotlib Tutorials | Examples | Interview Questions | Pandas Tutorials | Projects | Interview Questions | OpenCV Tutorials | Projects | Interview Questions | ExpressJS Tutorials | Projects | Interview Questions | Dart | Python Data Structures and Algorithms | Rust Tutorials | Projects | Interview Questions | Aptitude Tests | HackerRank Python | Django | MongoDB Tutorials | Examples | Interview Questions | NumPy Practice Questions | Python Tutorials by CodersDaily | Golang Tutorials | Projects | Interview Questions | React.js Tutorials | Verbal Ability Tutorial | MS Sql Server Tutorials | Examples | Interview Questions | Power BI Tutorials | Projects | Interview Questions | Example Dashboards | Numpy Tutorials | Projects | Interview Questions | Django REST Framework Tutorial | HackerRank C++ Solutions | Pandas Practice Questions | Tensor Flow | Python Practice Questions | C++ Tutorials | Quantitative Ability Tutorial | Google Sheets Mastery: From Basics to Dashboards | Langchain Tutorials | Javascript | Node.js Tutorials | HackerRank SQL Solutions | HackerRank DSA Solutions | Verbal Aptitude 2 | HackerRank Java Solutions | HTML Tutorial | TCS NQT Mock Test Series | Reasoning Ability Tutorial | CodeChef Python Solutions | HackerRank C Program Solutions | Leetcode Python Solutions | SQL Practice Question | Matplotlib Practice Questions |Interview Questions :
Pandas Tutorials | Projects | Interview Questions | ExpressJS Tutorials | Projects | Interview Questions | Django | Python Tutorials by CodersDaily | Golang Tutorials | Projects | Interview Questions | Numpy Tutorials | Projects | Interview Questions | Django REST Framework Tutorial | Matplotlib Practice Questions | Matplotlib Practice Questions | Matplotlib Practice Questions | Matplotlib Practice Questions | Matplotlib Practice Questions | Matplotlib Practice Questions | Matplotlib Practice Questions | Matplotlib Practice Questions | Matplotlib Practice Questions | Matplotlib Practice Questions |Top Colleges in India :
Indian Institute of Technology Bombay | Jaypee University of Engineering and Technology - Guna |